- Thread starter
- #81
Skybound
Well-Known Member
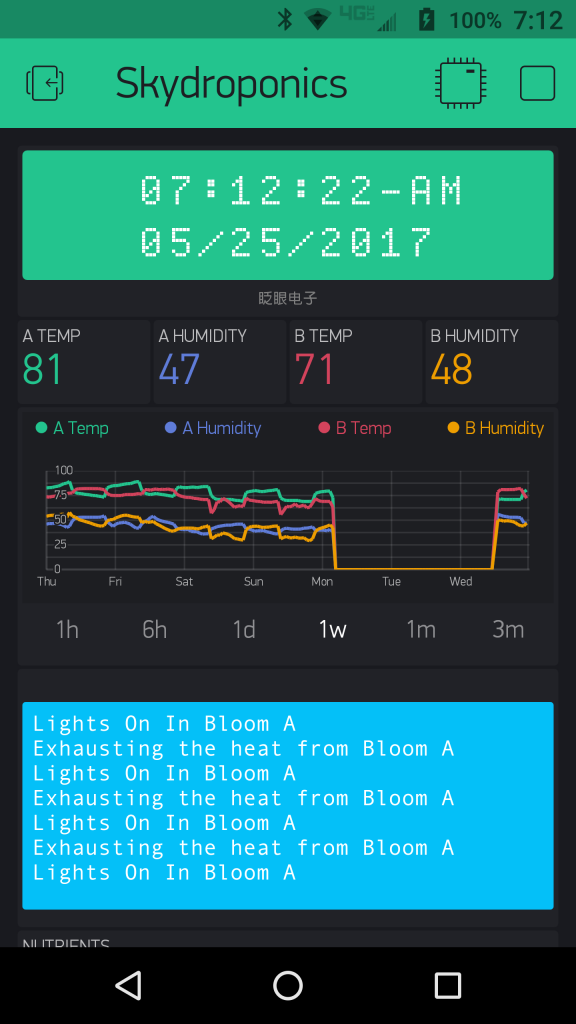
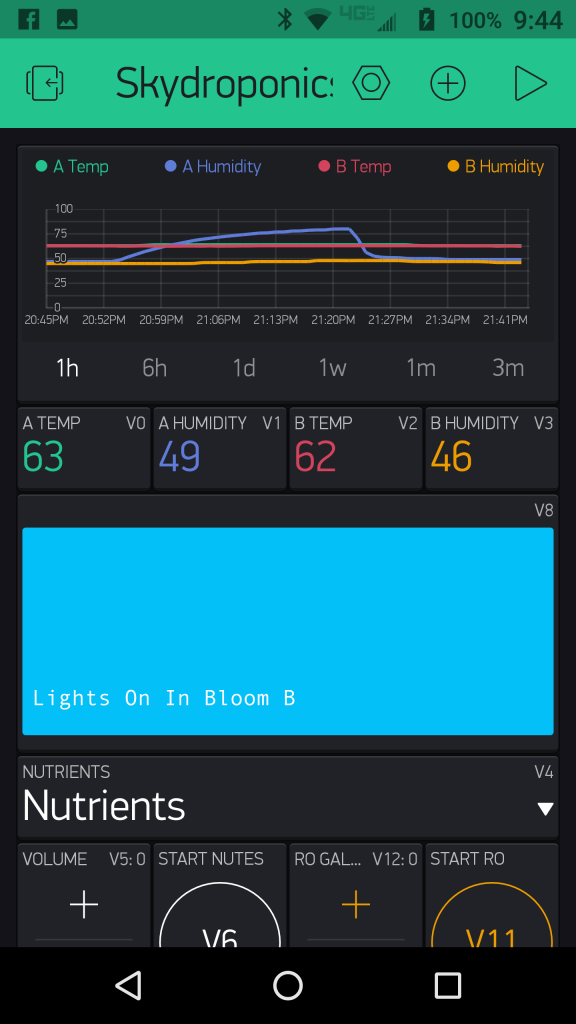
I added a little functionality to my grow by adding a History Graph widget to my Blynk app. This displays the temp and RH readings from both bloom rooms (though room B is still vacant) onto a timeline that can focus in to hourly trends, 6 hour, 1 day, 1 week, 1 month or 3 month increments which adds a bit more information for me to consider. I also, believe I may have stumbled onto the source of all my code lockup issues. I made the adjustment over 2 days ago and it's been behaving very well ever since. I did have to cut the connection just a few minutes ago so that I could add the History Graph widget, but after rearranging all my widgets and setting the pins, I clicked the play button, and right back into my grow my phone took me. I come to find out, my exhaust fan was accidentally unplugged and RH (in bloom A) skyrocketed. A quick text message, and we're back on track. I wish I knew what my ppm and PH was right now? I really can't wait to go down that road!

")